23 Threats to the integrity of the experiment
The randomisation design and data collection plan describe how the study is meant to proceed. But rarely does everything go to plan.
In this section, I discuss four threats to the integrity of an experiment: partial compliance; attrition; spillovers; and evaluation-driven effects.
23.1 Partial compliance
Partial compliance occurs when some people in the treatment group do not take up a program or others in the comparison group do.
Partial compliance can occur when:
- People in the treatment group are not treated. For example, some clients assigned to a mailing information intervention may never open the letter.
- People in the treatment group do not complete the treatment course. For example, some firms in a fertiliser program may save fertiliser for the next planting season or sell it instead of using it for the current season.
- People in the comparison group receive the treatment. For example, control group members may move to a treatment group location.
- Implementation staff depart from the allocation or treatment procedures. For example, program managers could deviate from the randomised allocation and extend services based on their judgment of need or personal relationships.
- People exhibit the opposite of compliance. In some unusual cases, providing access to a program or encouraging take-up of the program may have a perverse effect and reduce takeup. Similarly, excluding people from a program may make them think they are missing out on something great and generate greater take-up. People who behave in this counterintuitive way are called defiers (reacting in exactly the opposite way to what we predicted in the protocol).
Non-compliance can undermine the trial:
- Noncompliance can reduce comparability between the treatment and comparison groups. The program we want to evaluate should be the only systematic difference between the treatment and comparison groups. Partial compliance by implementation staff can reduce comparability between the two groups.
- Noncompliance can reduce the difference between the treatment and comparison groups in exposure to the program. To detect a program’s impact, our treatment group must be significantly more likely to receive the program than those in the comparison group. Partial compliance narrows the gap in actual treatment rates between the groups.
- Defiers can make it impossible to estimate the true impact of a program.
To limit partial compliance:
- Make take-up of the program easy. Complicated application procedures can sharply reduce take-up, as can inconvenient locations.
- Incentivise take-up of the program. We may want to encourage take-up by providing a small incentive. We do not want the incentive to be so large that it will change outcomes.
- Include a basic program that everyone receives, including the comparison group.
- Don’t drop non-compliers from the analysis. Dropping noncompliers from the sample or changing anyone’s randomly assigned treatment status based on actual treatment would reintroduce selection bias, defeating the careful work we did to achieve internal validity. People who fail to comply are systematically different from those who do comply.
To account for partial compliance in the analysis, we have to document compliance in the treatment and comparison groups in the same way.
23.1.1 Intention to treat
Partial compliance is also dealt with by measuring the “intention to treat” impact. This is an analysis based on the treatment assignment, not the assignment actually received.
Consider a trial to test whether we can encourage customers to use their tax refund to pay their high-interest debts (Johnson and Wang-Ly, 2020). Two messages were sent:
- A message mid-June to prompt customers to think about how they could make the most of their tax refunds, with paying down debt given as an option.
- A post-tax refund message reminding them of the opportunity to pay down debts and taking them through the repayment experience if they choose to do so.
It was found that:
- Customers in the treatment condition were 2.7 percentage points more likely to make a credit card repayment within two days of receiving their tax refund
- Customers in the treatment condition averaged $25 higher repayment amounts within two days.
This measure of impact is an “intention to treat” impact. In this case, the analysis is based on the customer being sent a message, not on whether they read it or opted in to receive a reminder at the time of the tax refund.
When we find an Intention to treat impact, this could result from two different scenarios.
- There was low take-up but a large impact on those who took it up.
- There was widespread take-up but a moderate impact on those who took it up.
The intention to treat estimate is the same under both scenarios, but the estimate of the impact on “compliers” is different.
This estimated impact on “compliers” is known as the Wald estimator. It is calculated as:
\text{Estimate of impact on compliers}=\frac{\text{mean in treatment}-\text{mean in comparison}}{\text{take up in treatment}-\text{take up in comparison}}
The estimate on compliers is useful when we use an encouragement design. We randomise the encouragement to take up the program rather than access to the program itself. In these designs, we may be less interested in the impact of the encouragement than in the impact of the program whose take-up the encouragement is designed to increase.
For example, if we provide encouragement to sign up for a bank account, we might be more interested in the impact of having a bank account on savings rather than in the impact of a program that provides coupons to sign up for a bank account.
It is inappropriate to use an estimated impact on compliers when the assumption that treating the compliers has no effect on the outcomes of the non-compliers does not hold. This can occur when:
- there are positive (or negative) effects from being offered the program even if it is not taken up because not all of the impact of the program is concentrated in those who take it up (e.g., being offered a scholarship boosts confidence, which may influence earnings)
- there are positive or negative spillovers within the treatment group.
23.2 Attrition
Attrition is the absence of data because the researchers cannot collect some or all of the outcome measures from some people in the sample. This can occur when participants drop out or refuse to be interviewed. Attrition creates a problem of missing data.
Attrition can reduce the comparability of treatment and comparison groups. Consider the following example:
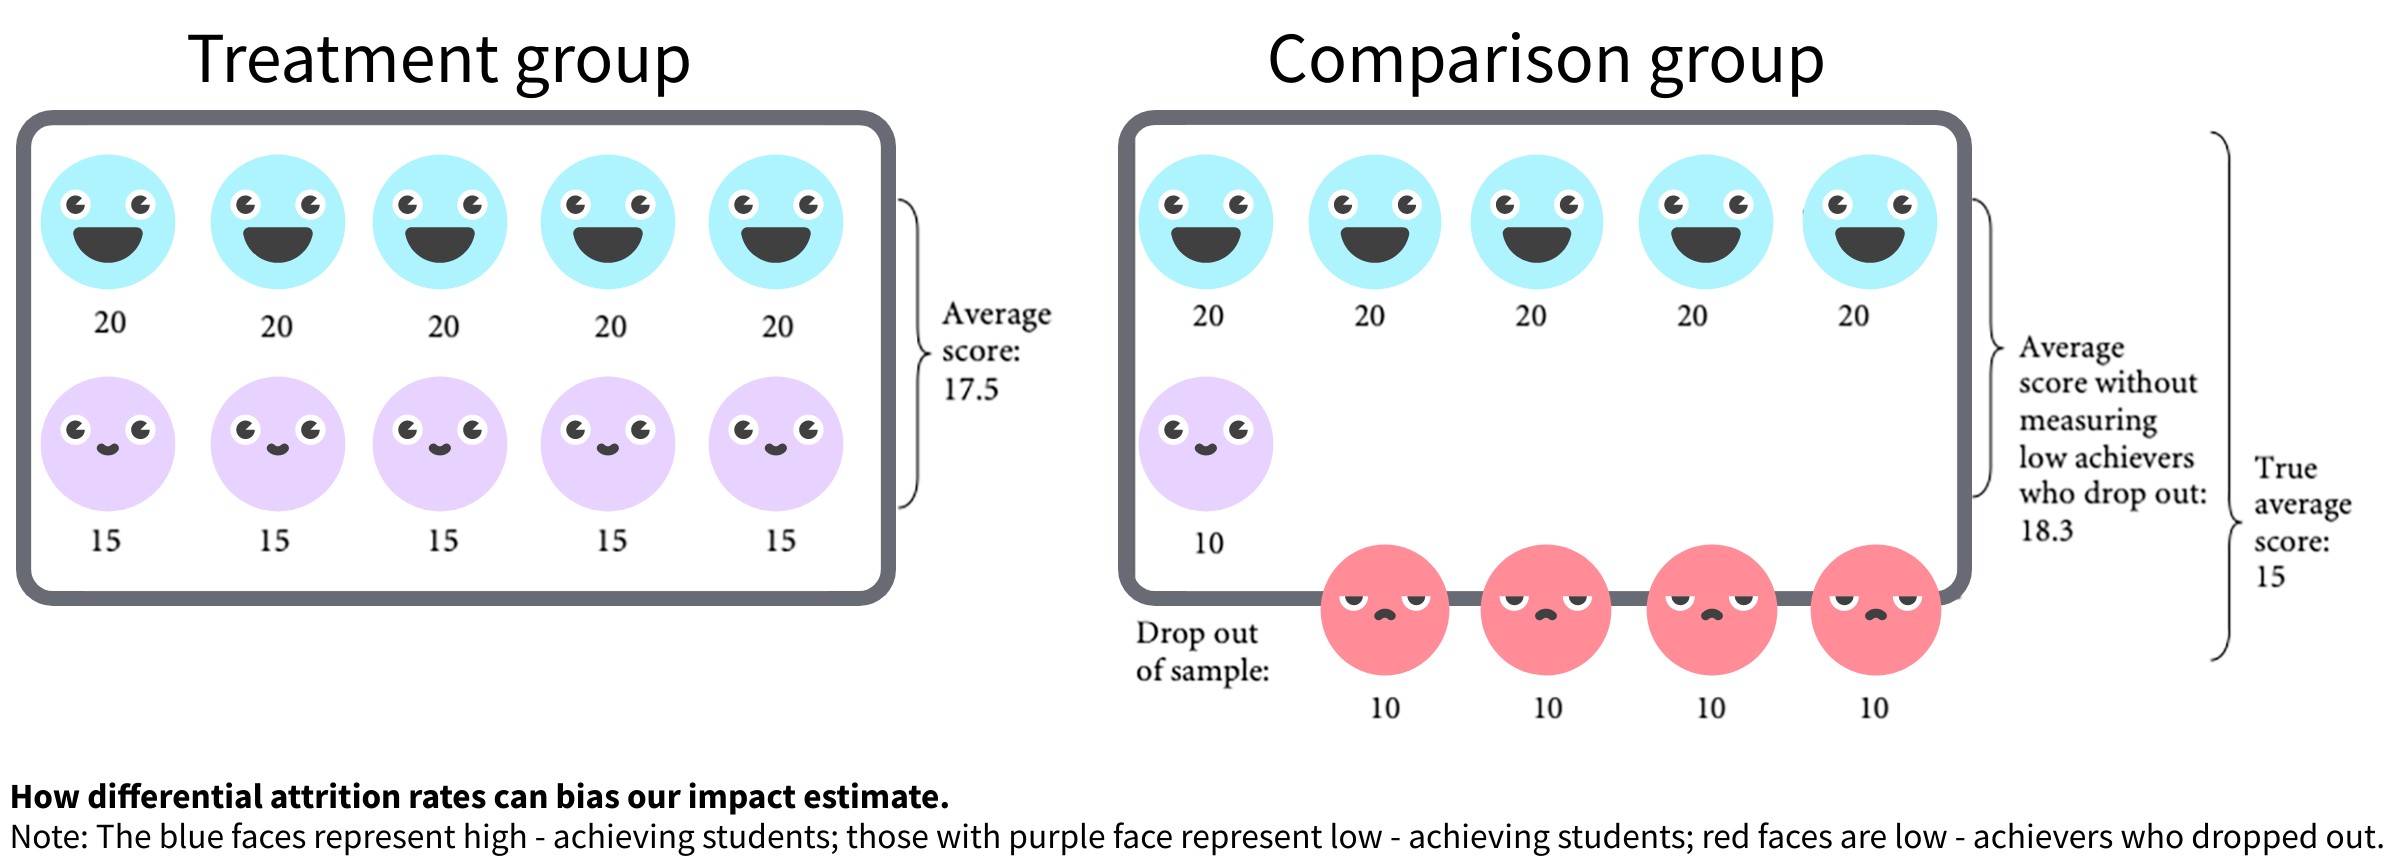
Imagine that a program increased the test scores of low-achieving students from an average score of 10 to an average score of 15 (image below). Overall, the average score for the class increased from 15 to 17.5. And because the low-achieving students in the treatment group were given support, they did not drop out of school, as many of their peers in the comparison group did. However, if we had measured the test scores only of those children who stayed in school, we would have concluded that the program worsened test scores, from 18.3 in the comparison group to 17.5 in the treatment group.
Attrition also reduces the sample size, lowering statistical power.
We can limit attrition by:
- Using a research design that promises access to the program to all over time. People who anticipate receiving a program in the future may be less likely to refuse to participate in the study. We could use a design that creates this expectation (phase-in design)
- Changing the level of randomization. It is possible that if people see their neighbours being treated but are not treated themselves, this can lead to resentment, and resentment can lead to attrition.
- Improving data collection (survey design, administration, and tracking). Pilot the data collection instruments and procedures. Poorly designed data collection instruments and procedures can lead to missing data. Don’t wait too long to follow up. The longer the gap between surveys, the higher the attrition rate is likely to be.
- Providing incentives. Small incentives can have large impacts on behaviour
Despite our best efforts, there is usually at least some attrition. If there is attrition:
- Determine the overall attrition rate. What is the rate of attrition in the whole sample?
- Check for differential attrition. Are the rates different in the treatment and comparison groups? Are the same types of people attriting in the treatment and comparison groups? Is attrition correlated with any observables?
- Determine the range of the estimated impact given the attrition. What is the greatest and least impact the program could have had, given the attrition we observe?
To determine the range of the estimated impact given the attrition, we can construct Manski-Horowitz bounds for the treatment effect by assigning outcomes to people who have dropped out.
- Upper bound: constructed by assigning the most favourable outcome to all those who drop out of the treatment group and assigning the most negative outcome to all those who drop out of the comparison group.
- Lower bound: constructed by assigning the most favourable outcome to the dropouts from the comparison group and the most negative to the dropouts from the treatment group.
The method requires the true value of the outcome of interest to lie in some bounded interval.
23.3 Spillovers
Spillovers occur when the effect on those receiving treatment produces a secondary effect on those not treated. If there are positive (negative) spillovers, the estimated impact will be underestimated (overestimated).
Some types of spillovers include:
- Physical: For example, people immunised by a program reduce disease transmission in their community.
- Behavioural: For example, if some children go to school more, this may encourage others to go.
- Informational: For example, people learn about the usefulness of a new financial app from others who received this knowledge from the program.
- Marketwide: For example, older workers lose their jobs because firms receive financial incentives from the program to hire young workers.
Spillovers reduce the quality of the counterfactual. The comparison group is no longer as good a counterfactual because their outcomes reflect indirect program effects, not the outcomes in the absence of the program.
Spillovers threaten the evaluation if we do not consider them in the design and/or analysis phase. The program’s impact will be underestimated if the evaluation does not capture or account for positive spillovers from treatment to comparison. The impact will be overestimated if it does not capture or account for negative spillovers.
We can manage spillovers by:
- Identifying potential spillovers. That means asking the following questions: What, who, how? We can use common sense, previous studies, existing theories, and logical frameworks to anticipate potential spillovers.
- Reducing spillovers to the comparison group. For example, could we change the level of randomisation?
- Estimating the spillover effects by measuring outcomes of the untreated in or near the treated units. We need to systematically collect data on outcomes for those not directly treated but whom we expect to be affected indirectly (e.g. neighbours of people in the treatment and control group). We now have three groups: the treatment group, the spillover group (i.e., the part of the comparison group that may be affected by the program), and the non-spillover comparison group. We then estimate the impact on both the treatment group and the spillover group in relation to the uncontaminated comparison group. This approach is valid only when it is randomly determined whether an individual from the comparison group ends up in the spillover or non-spillover groups.
23.4 Evaluation-driven effects
Being part of an evaluation can change the way people behave, independent of any impacts of the program.
Evaluation-driven effects include:
- Hawthorne effects: The treatment group works harder than normal. For example, a student who wins a scholarship through a lottery among many eligible students may work especially hard because she feels she has been given a “rare opportunity” and does not want to fail the program.
- John Henry effects: The comparison group starts competing with the treatment group.
- Resentment and demoralisation effects: The comparison group resents missing out on the treatment.
- Demand effects: The participants change their behaviour in response to their perception of the evaluators’ objective.
- Anticipation effects: The comparison group changes their behaviour because they expect to receive the treatment later.
- Survey effects: Being surveyed (frequently) changes the subsequent behaviour of the treatment or the comparison group.
Evaluation effects can undermine power and generalizability. Evaluation-driven behaviour can lead to outcome changes that would not occur without the evaluation, which reduces the generalizability of the results.
Evaluation-driven effects can undermine comparability. If the evaluation-driven behaviour is group specific (affecting only the treatment or only the comparison group), it undermines the comparability of the two groups.
Evaluation-driven effects can bias impact estimates. Hawthorne effects and social desirability effects can inflate the estimated impact of a program compared to its true impact by artificially boosting outcomes among the treatment group. John Henry effects deflate the estimated impact of the program by artificially boosting outcomes in the comparison group.
We can limit evaluation-driven effects by:
- Identifying potential sources of evaluation-driven behaviour change, such as interactions between the evaluation team and the treatment and comparison groups that would exist only in the evaluation context.
- Using a different level of randomisation. Limit the treatment-comparison interactions that generate demoralisation, anticipation, and competition.
- Not announcing the phase-in.
- Making sure the evaluation staff are impartial.
- Making sure the treatment and comparison groups get equivalent interaction with staff.
- Measuring the evaluation-driven effects on a subset of the evaluation sample. Create random variation in evaluation procedures to measure the effects.
For more information, see Glennerster and Takavarasha (2013b) and Glennerster and Takavarasha (2013a).